Webhook Logs Dashboard
The Webhook Logs Dashboard provides comprehensive monitoring and troubleshooting capabilities for webhook deliveries in your marketplace application. This guide covers how to access, navigate, and effectively use the dashboard to monitor your webhook integrations.
Table of Contents
- Overview
- Accessing Webhook Logs
- Understanding the Dashboard
- Using Date & Time Filters
- Searching Logs
- Filtering by Event Name
- Filtering by Status Code
- Navigating Through Pages
- Viewing Webhook Details
- Triggering a Manual Retry
- Clearing All Filters
- Common Use Cases
- FAQ
Overview
The Webhook Logs Dashboard enables you to:
- View all webhook events sent to your application
- Track success and failure rates
- Search for specific webhook IDs
- Filter by event type and status codes
- View detailed payload information
- Monitor retry attempts
- Manually retry failed webhook deliveries from the dashboard
- Work with different timezones
Accessing Webhook Logs
Navigation Steps
- Navigate to your Application Dashboard
- Click on Select The App You Want Logs For
- Select Insights from the left menu
- Click on Logs
- The Webhooks tab will be active by default
URL Pattern
/app-settings/{your-app-id}/dashboard/logs
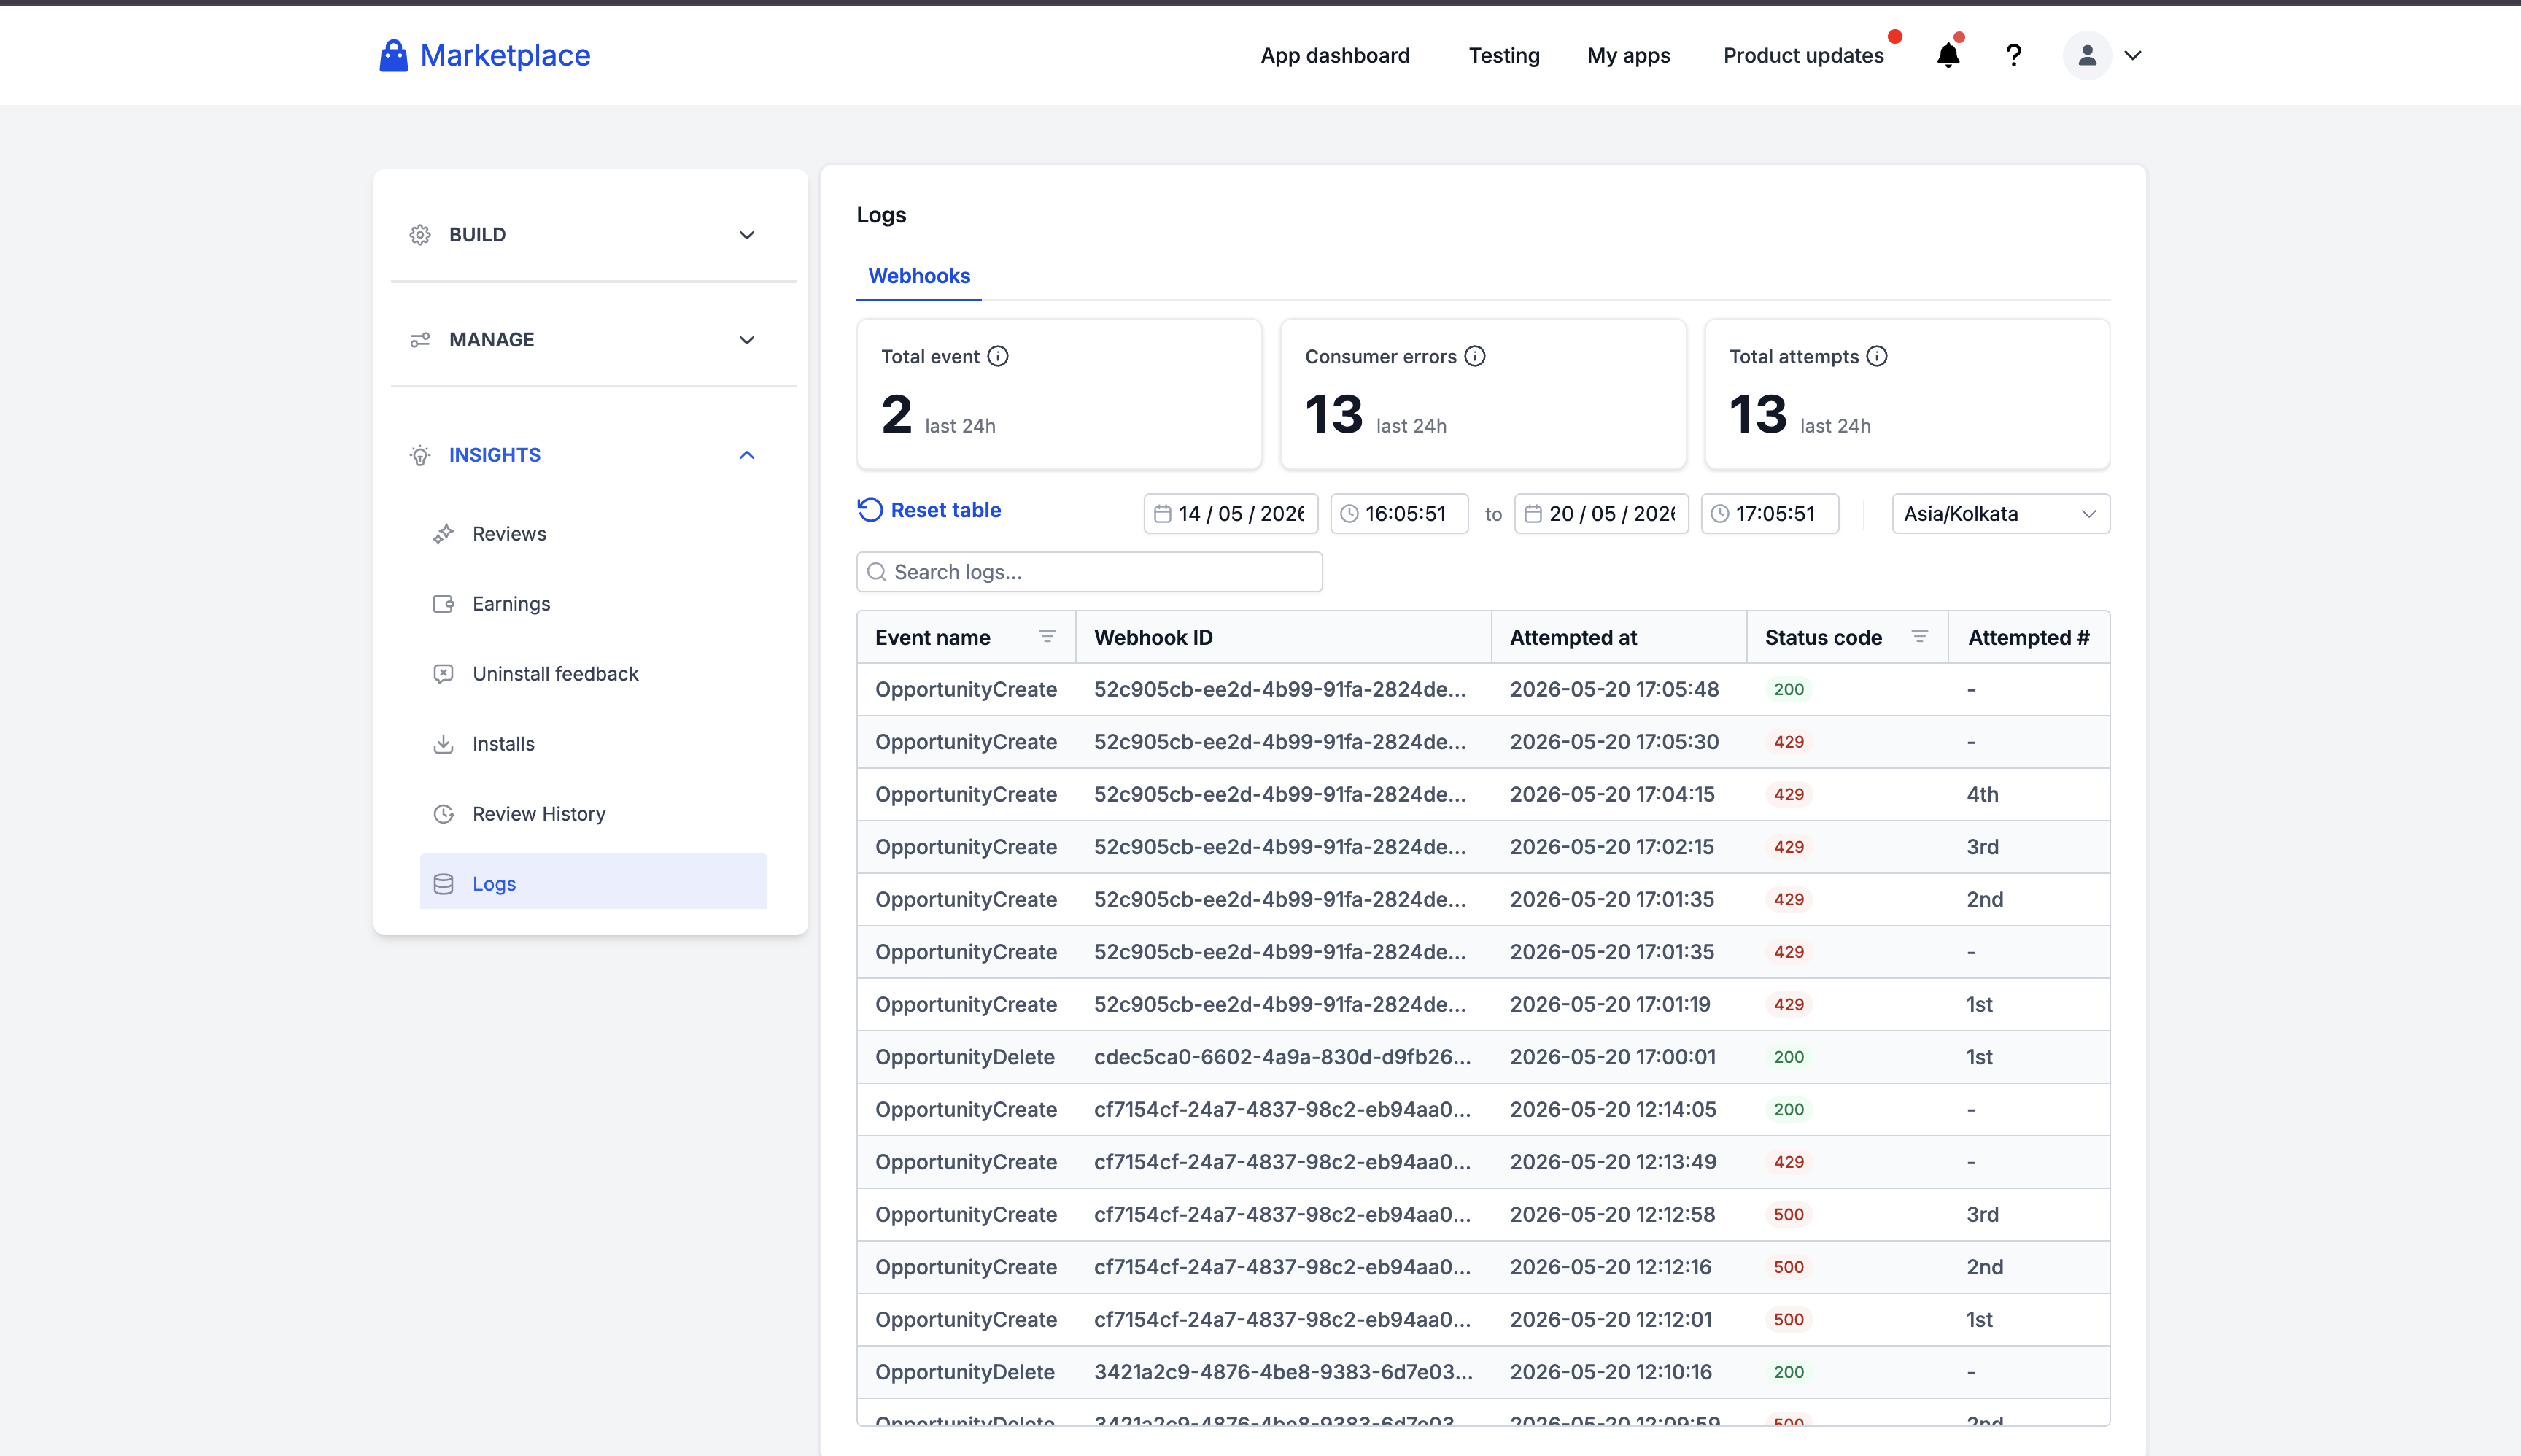
Understanding the Dashboard
Statistics Cards
The dashboard displays three key metrics at the top of the page. Important: These statistics show data for the last 24 hours and are independent of your date range filters.
Total Events
- Shows the number of unique events received during the selected period
- Includes both successful and failed webhooks
- Updates based on your selected date range and filters
- Deduplicates by webhook ID
Consumer Errors
- Displays webhooks that failed (non-2xx status codes)
- High numbers indicate potential issues with your webhook endpoint
Total Attempts
- Shows all delivery attempts including retries
- If this number is higher than Total Events, your app is experiencing retries
- Helps identify webhook delivery issues
NOTE: For any non-2xx response and for transport failures with no HTTP response, we retry up to 12 times (excluding the original attempt) using exponential backoff with jitter. For detailed retry policy information, see the Error Handling and Retries section.
Logs Table
The logs table displays the following columns:
| Column | Description | Example |
|---|---|---|
| Event Name | Type of webhook event | ContactCreate, INSTALL |
| Webhook ID | Unique identifier for tracking | abc123def456... |
| Attempted At | When the webhook was sent | 2024-11-13 14:30:45 |
| Status Code | HTTP response status | 200 (success) or 404 (error) |
| Attempt # | Delivery attempt number. Automatic retries are numbered sequentially (1st, 2nd, 3rd, etc.). Developer-triggered retries are displayed as -. | 1st, 2nd, - |
Status codes are color-coded: green for success (2xx) and red for errors (all others).
Using Date & Time Filters
Date & Time Pickers
- By default, the logs display the last 1 hour of webhook activity
- You can change the date range with up to 1 second accuracy for any period within the past 30 days
- The date pickers provide quick shortcuts:
- Today: Jump to today's date
- Last 7 Days: View the past week
- Last 30 Days: View the past month (maximum range)
NOTE: Logs are retained for the last 30 days

Changing Timezone
All webhook times are stored in UTC, but you can view them in your local timezone for easier reading.
How to Change Timezone
- Locate the timezone dropdown on the right
- Click and start typing your timezone (e.g., "America/New_York")
- Select your timezone from the list
- All times will instantly convert to your selected timezone
Timezone Features
- Your selection is saved automatically
- All times in the table update immediately
- Modal details also display in your selected timezone
- Search for timezones by typing
Example:
- UTC:
2024-11-13 14:30:00 - Eastern Time:
2024-11-13 09:30:00
Searching Logs
Global Search Bar
The search bar is located in the top-left of the table and allows you to search for specific webhooks.
What You Can Search
- Webhook ID: Enter the full or partial webhook ID
- Webhook Payloads: Enter the value or full key-value pair to search in the payload
How to Search
-
Click in the search box
-
To search by webhook ID: Type your webhook ID (e.g.,
abc123....) -
To search by payload: Enter the value or full key-value pair from the payload
Example payload:
{
  "type": "OpportunityCreate",
  "locationId": "3jJ0coeqWCZMAosyGQ6K",
  "versionId": "6878cec452e7c8d29d4dd3d9",
  "appId": "6878cec452e7c8d29d4dd3d9",
  "id": "UHXrFfZGSH5rj7z5rdDP",
  "name": "Test 2",
  "assignedTo": null,
  "contactId": "VQxH1EeoFPg9uhhnCeJx",
  "pipelineId": "WQ7tyljQSXAg7GuTgYdd",
  "pipelineStageId": "403af14e-9afb-40b1-b394-0aa6bbe0cc5e",
  "status": "open",
  "dateAdded": "2025-11-07T12:40:44.510Z",
  "timestamp": "2025-11-07T12:46:45.953Z",
  "webhookId": "881b9415-5d35-4ff1-a667-0545b80b96c0"
}- Any substring of value will work. ex -
FPg9uhhnCe(substring from contactId) - Any one key-value pair will work. ex -
"contactId": "VQxH1EeoFPg9uhhnCeJx"orname: Test 2(quotes not important) - random substring of json will not work. ex -
sionId": "6878cec452e7c8d29d4dd3d9", "appId": "6878cec452e7c - multiple key values will not work. ex -
"appId": "6878cec452e7c8d29d4dd3d9", "id": "UHXrFfZGSH5rj7z5rdDP"
- Any substring of value will work. ex -
-
Results will update automatically

Search Features
- Search is case-insensitive
- Partial matches work (search "abc" finds "abc123def")
- Click the X button to clear search
- Search works with other filters simultaneously
Filtering by Event Name
Opening the Filter
- Find the Event Name column header
- Click the filter icon (funnel symbol)
- A dropdown menu will appear

Sorting Options
- Sort A-Z (Ascending): Click to sort events alphabetically
- Sort Z-A (Descending): Click to sort events in reverse order
- A blue checkmark indicates the active sort
NOTE: Click on it again to remove the sort
Filter by Condition
Filter event names by text patterns.
Available Conditions
- None: No text filtering (default)
- Text contains: Show events containing your text
- Text does not contain: Exclude events with your text
- Text starts with: Show events beginning with your text
- Text ends with: Show events ending with your text
- Text is exactly: Show only exact matches
How to Use
- Click "Filter by Condition" to expand
- Select a condition from the dropdown
- Type your search text in the input box
- Click "Apply" at the bottom
Example:
- Condition: "Text starts with"
- Input: "Contact"
- Result: Shows
ContactCreate,ContactUpdate,ContactDelete,ContactDndUpdate&ContactTagUpdate
Filter by Values (Checkboxes)
Select specific event names to view.
How to Use
- Click "Filter by Values" to expand
- You'll see checkboxes for all available events
- Use the search box to filter the checkbox list
- Select All: Check all visible events
- Clear: Uncheck all events
- Select one or more event names
- Click "Apply" at the bottom
Clearing Event Name Filters
- Click "Clear" button at the bottom of the filter dropdown
- Or use the main "Clear Filters" button at the top
Filtering by Status Code
Opening the Filter
- Find the Status Code column header
- Click the filter icon (funnel symbol)
- A dropdown menu will appear
Quick Filter Options
- Filter By Success: Click to show only successful webhooks (status codes 200-299)
- Filter By Failure: Click to show only failed webhooks (includes all non-2xx status codes: 3xx redirects, 4xx client errors, and 5xx server errors)
- A blue checkmark indicates when a filter is active
Note: You can only use one quick filter at a time (Success OR Failure)
Filter by Specific Status Codes
Select exact status codes to view. You can select multiple status codes simultaneously (e.g., 200 and 404) to create custom filter combinations.
How to Use
- Click "Filter by Values" to expand
- See checkboxes for common HTTP status codes:
- Success: 200, 201, 204
- Client Errors: 400, 401, 403, 404, 422, 429
- Server Errors: 500, 502, 503, 504
- Use the search box to find specific codes
- Select All: Check all status codes
- Clear: Uncheck all
- Select the codes you want to see
- Click "Apply"
Status Code Colors
- Green tag = Success (200-299)
- Red tag = Error (all others)
Navigating Through Pages
Pagination Controls
Pagination controls are located at the bottom-right of the table.
Changing Rows Per Page
- Locate the "Rows per page" dropdown
- Choose from:
- 10 rows (default)
- 20 rows
- 50 rows
- Table updates immediately
Moving Between Pages
Using Page Numbers
- Click any page number to jump to that page
- Current page is highlighted in blue
- Shows up to 7 page numbers at a time
Using Previous/Next Buttons
- Previous: Go back one page (disabled on first page)
- Next: Go forward one page (disabled on last page)
Note: Your filters remain active when you change pages.
Viewing Webhook Details
Opening the Details Modal
- Click on any row in the logs table
- The Webhook event details modal will appear with full delivery information
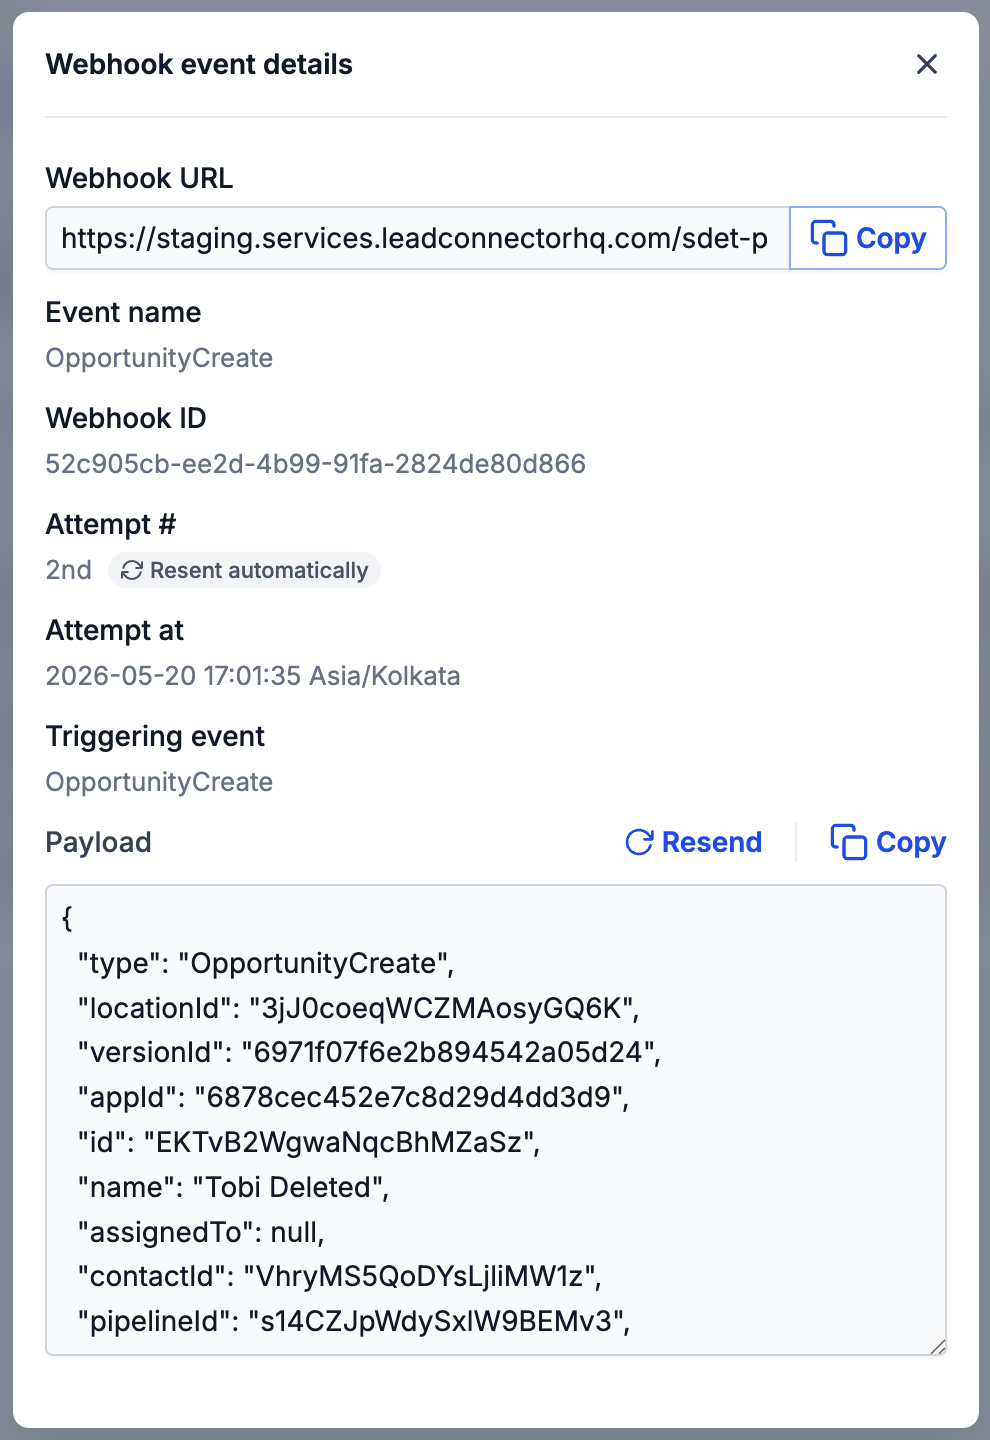
What You'll See
Webhook URL
- The endpoint where the webhook was sent
- Copy button: Click to copy the URL to your clipboard
- Useful for verifying the correct endpoint
Event Information
- Event Name: Type of webhook (e.g.,
ContactCreate) - Webhook ID: Unique identifier for this webhook
- Attempt #: Which delivery attempt (
1st,2nd,3rd, etc.). Automatic retries may show a badge such as Resent automatically in the modal - Attempted At: When it was sent (in your selected timezone)
- Triggering Event: What caused this webhook
Payload
- JSON data sent with the webhook
- Automatically formatted for easy reading
- Copy button: Click to copy the entire payload
- Resend button: Manually redeliver the webhook when enabled (see Triggering a Manual Retry)
- Useful for:
- Debugging issues
- Understanding data structure
- Testing with sample data
Using the Payload
Copy or resend the payload
- Copy: Click to copy the JSON payload to your clipboard for debugging or local testing
- Resend: Click to manually redeliver the webhook when the button is enabled (see When Is Resend Available?)
Triggering a Manual Retry
When a webhook delivery has failed and you want to redeliver it, you can trigger a manual retry directly from the dashboard.
How It Works
- In the logs table, find the latest failed row for the webhook you want to redeliver (filter by failure or search by Webhook ID if needed)
- Click the row to open the Webhook event details modal
- In the Payload section, click Resend (enabled only for the latest failed attempt that has not already succeeded)
- The original payload is re-sent to your webhook URL
- A new row appears in the table with Attempt #
-
When Is Resend Available?
The Resend button is enabled only when:
- You are viewing the latest attempt for that webhook ID
- The webhook has not already been delivered successfully
If Resend is disabled, open the most recent row for that Webhook ID (an older attempt may have been superseded), or check whether a later attempt already succeeded.
What Happens After a Manual Retry?
- If it succeeds: The webhook is marked as delivered and any remaining scheduled retry is cancelled
- If it fails: The failure is logged. The manual attempt does not start its own automatic retry cycle, but any scheduled automatic retries for the original failure continue. You can use Resend again after fixing the issue
Clearing All Filters
When to Clear Filters
- You've applied multiple filters and want to start fresh
- You're not seeing expected results
- You want to view all webhooks in the date range
How to Clear
- Locate the "Clear Filters" button (top-left, blue text with refresh icon)
- Click the button
- All filters are removed instantly
What Gets Cleared
- Search text
- Event name filters (sort, conditions, selected values)
- Status code filters (sort, selected values)
- Pagination resets to page 1
What Stays
- Date & time range (not cleared)
- Timezone selection (not cleared)
Note: The button is only enabled when you have active filters.
Common Use Cases
Use Case 1: Finding a Specific Webhook
Scenario: Support provided a webhook ID to investigate
Steps:
- Copy the webhook ID
- Paste it in the search bar
- Press Enter or wait for auto-search
- Click the row to see full details
Use Case 2: Troubleshooting Failed Webhooks
Scenario: Your app isn't receiving webhooks properly
Steps:
- Open Status Code filter
- Click "Filter By Failure"
- Click "Apply"
- Review the failed webhooks
- Click rows to see error codes and payloads
- Look for patterns:
- All 404? Your endpoint URL might be wrong
- All 401? Check authentication
- All 500? Your server has errors
Use Case 3: Checking Retry Behavior
Scenario: You want to see if webhooks are being retried
Steps:
- Look at the "Attempt #" column
- Search for a specific Webhook ID that appears multiple times
- Look for entries like
2nd,3rd,4th, or-(developer-triggered resend) - High attempt numbers indicate persistent failures
- Click to view details and see what changed between attempts
Use Case 4: Monitoring Event Volume
Scenario: You want to know how many webhooks you're receiving
Steps:
- Set date range to "Last 7 Days" or "Last 30 Days"
- Look at "Total Events" statistic
- Compare to "Total Attempts"
- High difference indicates many retries happening
- Check "Consumer Errors" to see failure rate
Use Case 5: Focusing on Specific Events
Scenario: You only care about contact-related webhooks
Steps:
- Open Event Name filter
- Click "Filter by Values"
- Type "CONTACT" in the search box
- Select all contact events:
ContactCreateContactUpdateContactDelete
- Click "Apply"
- Now you only see contact webhooks
Use Case 6: Investigating Issues at Specific Time
Scenario: Your app had issues yesterday at 2 PM
Steps:
- Select your timezone first
- Set start date/time to yesterday 2:00 PM
- Set end date/time to yesterday 3:00 PM
- Open Status Code filter
- Click "Filter By Failure"
- Review what went wrong during that hour
Use Case 7: Comparing Success vs Failure
Scenario: You want to see the success rate
Steps:
- Note "Total Events" number
- Note "Consumer Errors" number
- Calculate: (Total Events - Consumer Errors) / Total Events × 100
- Example: (1000 - 50) / 1000 = 95% success rate
- Filter by failures to investigate the remaining percentage
Use Case 8: Post-Deployment Verification
Scenario: You just deployed a webhook fix
Steps:
- Note the deployment time in your timezone
- Set start time to deployment time
- Set end time to now
- Filter by the event name you fixed
- Check "Consumer Errors" should be low/zero
- Click rows to verify correct payloads
Use Case 9: Manually Retrying a Failed Webhook
Scenario: Automatic retries failed but you've fixed the issue on your server
Steps:
- Filter by Status Code → Filter By Failure
- Find the latest failed row for the webhook (search by Webhook ID if needed)
- Open the modal and confirm Resend is enabled
- Click Resend
- Verify the new row shows Attempt #
-and a success status code
FAQ
Why is no data showing in the logs?
Check Your Date Range:
- Make sure start date is before end date
- Invalid ranges show an error message
- Try using the "Last 7 Days" shortcut
Check Your Filters:
- Click "Clear Filters" button
- Remove any event name or status code filters
- Clear the search box
Verify Webhooks Are Configured:
- Go to your app's Webhooks settings
- Ensure webhook URLs are configured
- Check that events are subscribed
For detailed guide on setting up webhooks, please refer to the Webhook Integration Guide.
Why don't the times look right?
Timezone Issue:
- Check the timezone selector
- Select your correct timezone
- Times should update immediately
Still Wrong?
- Try refreshing the page
- Clear browser cache
- Check if your system timezone is correct
I can't find a specific webhook. What should I do?
Try Broader Search:
- Use partial Webhook ID (first few characters)
- Expand your date range
- Remove other filters first
Check Spelling:
- Webhook IDs are case-sensitive in some systems
- Try copying and pasting exactly
Why isn't my filter working?
Did You Click Apply?
- Filters require clicking "Apply" button
- Just selecting options doesn't activate them
Conflicting Filters:
- Text conditions clear selected values
- Selected values clear text conditions
- Success/Failure sorts clear specific status code selections
Try Clear and Reapply:
- Click "Clear" in the filter dropdown
- Reapply your filter
- Click "Apply"
I can't open the details modal. How do I fix this?
Row Not Clickable?
- Make sure you're clicking the row, not just hovering
- Check browser console for errors (F12)
- Try a different row
Modal Shows Error:
- The webhook detail might be unavailable
- Try refreshing the page
- Contact support if it persists
Why isn't the copy button working?
Browser Permissions:
- Modern browsers require HTTPS for clipboard
- Check if site is secure (padlock icon)
- Try allowing clipboard permissions in browser settings
Manual Copy:
- Select the text manually
- Right-click → Copy
- Or use Ctrl+C (Windows) / Cmd+C (Mac)
Why don't the statistics match my expectations?
Statistics Respect Filters:
- If you've filtered by event name, stats only show those events
- If you've filtered by failures, stats only show failed webhooks
- Click "Clear Filters" to see overall stats
Date Range Matters:
- Statistics only count webhooks in your selected date range
- Expand the date range to see more data
What does - mean in the Attempt # column?
It indicates a delivery attempt that was triggered by a developer using Resend in the dashboard, rather than by the automatic retry system.
Why is the Resend button disabled?
Resend is only enabled for the latest attempt of a webhook that has not been delivered successfully. If the button is disabled, open the most recent row for that Webhook ID, or check whether a later attempt already succeeded.
Will a failed manual retry trigger more automatic retries?
No additional automatic retries are started for the manual attempt itself. If a manual retry fails, scheduled automatic retries for the original failure continue as before. You can also use Resend again after resolving the issue.
What happens to scheduled retries if my manual retry succeeds?
Any remaining scheduled retry is automatically cancelled to prevent duplicate deliveries.
Need More Help?
- Community: Join our developer community for questions and support
- Support: Contact our developer support team for technical assistance
This guide is designed to help you effectively monitor and troubleshoot webhook deliveries. For integration setup and detailed webhook event documentation, please refer to the Webhook Integration Guide and the Complete Webhook Documentation.